Market metrics - stock indexes, treasury yields and gold, silver, and WTI oil over the past week
building on Lastlib's every Friday market metrics in Personal Finance and Investing Group
Percentage change from 3/6 to 3/13
(the yield changes are the percentage points differences,
e.g. for the 2-Y Treasury, it went from 3.56% to 3.72%. a change of +0.16%)
PctChg, Entity, 3/13 closing value
------------------------------
-1.99% Dow 46,558.47
-1.60% S&P 500 6,632.19
-1.26% NASDAQ 22,105.36
+0.16% 2-Yr Treas 3.72%
+0.13% 5-Yr Treas 3.86%
+0.15% 10-Yr Treas 4.28%
-3.05% Gold 5023.10
-5.41% Silver 80.11
+8.80% WT Oil 99.30
Treasury notes' yields up means the notes' values are down
as likely people's bond portfolios are down
For a 6- to 9-month perspective, depending on which graph, I like pasting these in because the automatically update. I wish I had one for the S&P 500, but I don't, oh well.
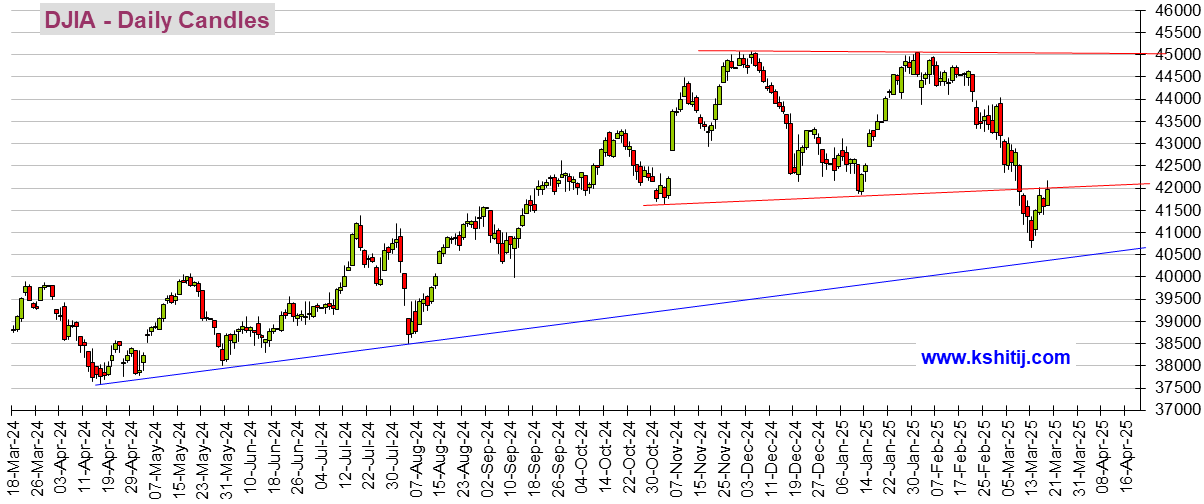
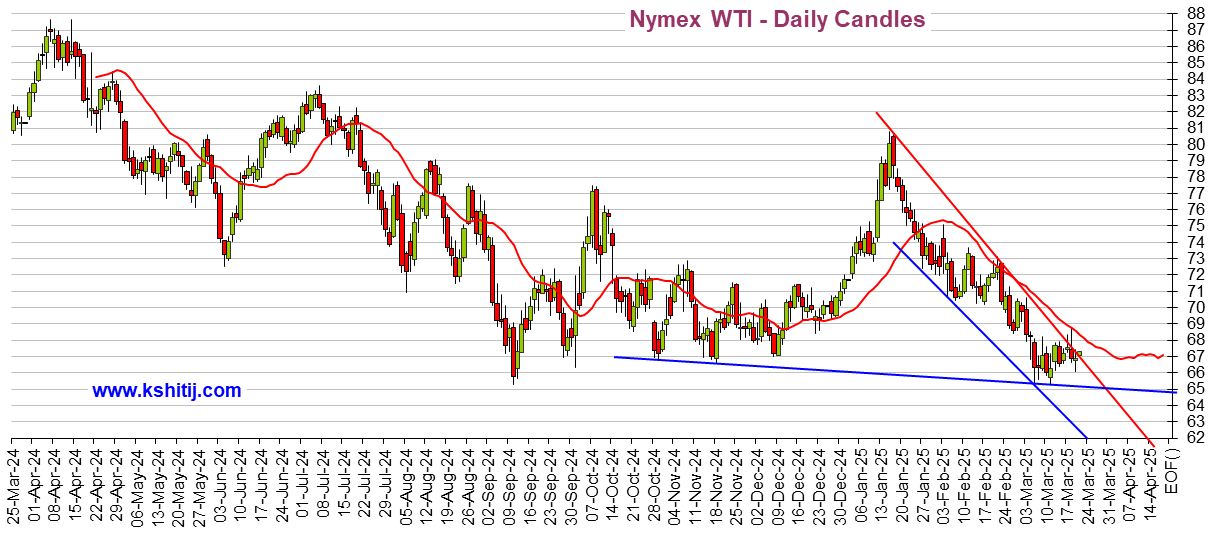
Dow, Oil, and Dollar (last several months) - they update a few hours (like about 6 hours) after the close
The attacks on Iran began on February 28.
Dow 30,
Crude Oil
US Dollar Index (DX-Y.NYB)
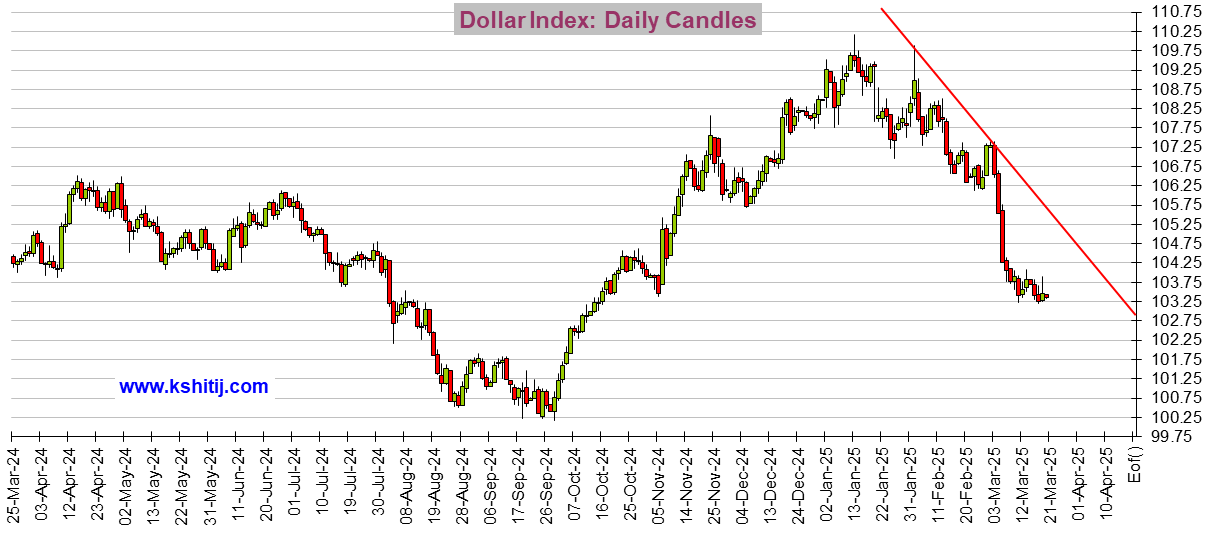
The graphs above update automatically. So they are up-to-date a few hours after each close.
There should be 3 graphs above. If you see little image squares and no graphs, right click on each such image square and choose Load Image.
 = new reply since forum marked as read